What are Bugs?
A software bug is any error that causes unwanted behavior and produces incorrect or unexpected results.
The term most likely originates from mechanical engineering, where actual bugs (insects) might crawl into machines and cause mechanical failures. Edison mentioned those in 1870. The term stuck and was migrated to software engineering.
What is Debugging?
The term debugging means to find and eliminate bugs in software systems. For this purpose, a wide range of tools are at our disposal, which helps us in finding bugs and the context in which they are occurring.
Types of bugs
Syntax Errors
This kind of bugs originates from syntactically incorrect source code. Usually such bugs are quite obvious, when the source code is executed and can thus be quite easily fixed.
>>> for x in in z:
  File "<stdin>", line 1
    for x in in z:
             ^^
SyntaxError: invalid syntax
Arithmetic
Floating point numbers are inherently inexact, and can sometimes give unexpected results. This needs to be taken into account, when dealing with fractions like in the next example:
>>> 0.1 + 0.1 + 0.1 + 0.1 + 0.1 + 0.1 + 0.1 + 0.1 + 0.1 + 0.1 == 1.0
False
Wrong design
In some cases, the implementation (the code) is correct, but the underlying design is flawed.
Memory leaks
Memory leaks are cases of bugs where more and more memory is consumed by creating objects which are never destroyed, thus requiring memory that is never freed up. At one point there will be no memory left and the program will crash.
>>> mylist = list(range(1_000_000))
>>> while True:
...     mylist = mylist * 2
...     print(len(mylist))
...
2000000
4000000
8000000
16000000
32000000
64000000
128000000
256000000
512000000
1024000000
Killed
Memory leaks can be quite subtle and sometimes hard to notice and may only show up under specific circumstances like very long running times.
Finding bugs
As previously stated, bugs typically show themselves with unexpected behavior and wrong results. The process of debugging is to locate the bugs in their specific context, so it is very helpful to see this context. The context is comprised of:
- variables (local variables and global ones)
- the "call stack": the stack of function calls at a specific location
In order to show the context and interact with it, we can use certain tools:
"Print-style" debugging
This style of debugging is common, as it is easily implemented by peppering the
code with print and similar statements in order to show the current state of
the program. Thus, it is easy to do and has a very low barrier.
import traceback

GLOBAL_VAR = 0

def a(a_arg):
    b(a_arg + 1)

def b(b_arg):
    my_variable = b_arg + 2
    # we print out all our function arguments, local and global variables
    print(b_arg)
    print(my_variable)
    print(GLOBAL_VAR)
    # our call stack is ->
    traceback.print_stack()

a(10)
However, this style of programming comes with significant drawbacks:
- you have to modify the source code in order to debug it. Often these print statements are forgotten and linger in the source code for quite some time.
- it is not possible to interact with the context during the debugging, the program needs to be stopped, changed, and started again.
- Tracing your variables can become quite messy, as both the variables name and value need to be printed, often before and after a certain location
Testing
Writing and regularly running tests can be quite helpful in locating bugs. Especially "unit" tests (i.e: tests that involve single classes or functions) can reduce the context of a class or function in order to see if it works as intended and is bug free.
def area_rectangle(a, b):
    if not isinstance(a, (int, float)) or not isinstance(b, (int, float)):
        raise ValueError("Expected a number")
    if a < 0:
        raise ValueError("Invalid side length")
    if b < 0:
        raise ValueError("Invalid side length")
    return a * b

# we test the normal use of the function
def test_area_rectangle_normal():
    assert area_rectangle(2, 3) == 6

# we test some invalid arguments
def test_area_rectangle_types():
    with pytest.raises(ValueError) as e_info:
        area_rectangle(None, "str")

# we test some edge cases
def test_area_rectangle_negative():
    with pytest.raises(ValueError) as e_info:
        area_rectangle(2, -3)
Using a debugger
Debuggers are tools that enable us to interact with a running program without the need to modify it. We can pause the program at specific break points where we can investigate and even modify the context, as well as moving up or down the current call stack.
There exist many different types of debuggers, some are built into the Python itself, some are built into the code editor, some are even available as a webpage.
We will now discuss the most common ones:
PDB - the Python De-Bugger
The PDB is part of the python standard library, thus it is always available. It is text-based and is meant to be used from the command line.
It can be invoked in several ways:
- either by using
breakpoint()calls in your code - or by starting your python script in a slightly different manner:
python -m pdb yourscript.py
Let us use the following script to debug, and save it as test.py:
def myfunc(myarg):
    myinnerfunc(myarg)
    myinnerfunc(myarg - 1)


def myinnerfunc(innerarg):
    return 1 / innerarg


myfunc(1)
When we run it normally we get this result:
$ python test.py
Traceback (most recent call last):
  File "test.py", line 10, in <module>
    myfunc(1)
  File "test.py", line 3, in myfunc
    myinnerfunc(myarg - 1)
  File "test.py", line 7, in myinnerfunc
    return 1 / innerarg
ZeroDivisionError: division by zero
We now want to debug the file by using PDB:
$ python -m pdb test.py
> test.py(1)<module>()
-> def myfunc(myarg):
(Pdb)
You can now see that the program has not yet started, but you get the (pdb)
prompt that allows you to set up pre-conditions and breakpoints in your code by
using the commands. You can get a list of commands by typing help:
(Pdb) help

Documented commands (type help <topic>):
========================================
EOF    c          d        h         list      q        rv       undisplay
a      cl         debug    help      ll        quit     s        unt
alias  clear      disable  ignore    longlist  r        source   until
args   commands   display  interact  n         restart  step     up
b      condition  down     j         next      return   tbreak   w
break  cont       enable   jump      p         retval   u        whatis
bt     continue   exit     l         pp        run      unalias  where

Miscellaneous help topics:
==========================
exec  pdb
You can get the description of a specific command by using help <cmd>:
(Pdb) help b
b(reak) [ ([filename:]lineno | function) [, condition] ]
        Without argument, list all breaks.

        With a line number argument, set a break at this line in the
        current file.  With a function name, set a break at the first
        executable line of that function.  If a second argument is
        present, it is a string specifying an expression which must
        evaluate to true before the breakpoint is honored.

        The line number may be prefixed with a filename and a colon,
        to specify a breakpoint in another file (probably one that
        hasn't been loaded yet).  The file is searched for on
        sys.path; the .py suffix may be omitted.
The following commands are important for us in the beginning:
b(reak): allows us to set a breakpoint, a point in your program where we want to stop to investigate. We can use a function name or a linenumber here. Optionally, we can add a condition, which will tell whether to a breakpoint shall trigger or not.c(ontinue): we want to continue the normal program execution until we reach the next breakpoint.s(tep): while paused, execute the next line in your program. If it is a function, step into that function and continue execution theren(ext): also execute the next line in your program, but don't step into a function. Instead, the function is run in its entirety and the results returned. The debugging is continued afterwards.w(here): show the current call stack and where we are currently debuggingu(p): move up the call stack (i.e: the calling function)d(own): move down the call stack. Only works when we usedupbefore
We now want to debug our function, so we set a breakpoint in our inner function:
(Pdb) b myinnerfunc
Breakpoint 1 at test.py:6
We can now start the program, it will stop at our myinnerfunc:
(Pdb) c
> test.py(7)myinnerfunc()
-> return 1 / innerarg
We can now check where we currently are in our programs call stack:
(Pdb) w
  /usr/lib/python3.10/bdb.py(598)run()
-> exec(cmd, globals, locals)
  <string>(1)<module>()
  test.py(10)<module>()
-> myfunc(1)
  test.py(2)myfunc()
-> myinnerfunc(myarg)
> test.py(7)myinnerfunc()
-> return 1 / innerarg
And we can print our variables:
(Pdb) innerarg
1
We can now move up the call stack, to inspect the variables in the calling function:
(Pdb) up
> test.py(2)myfunc()
-> myinnerfunc(myarg)
In order to see our context, we can list (print) the source code at that
location and print the local variable myarg:
(Pdb) l
  1     def myfunc(myarg):
  2  ->     myinnerfunc(myarg)
  3         myinnerfunc(myarg - 1)
  4
  5
  6 B   def myinnerfunc(innerarg):
  7         return 1 / innerarg
  8
  9
 10     myfunc(1)
[EOF]
(Pdb) myarg
1
We can then move down the call stack again:
(Pdb) d
> test.py(7)myinnerfunc()
-> return 1 / innerarg
We can now make the next execution step in the program, which calculates the
result and returns it. We can see that with the --Return-- and the result
returned (->1.0), and we can also see that we returned to the upper function
myfunc:
(Pdb) n
--Return--
> test.py(7)myinnerfunc()->1.0
-> return 1 / innerarg
(Pdb) l
  1     def myfunc(myarg):
  2         myinnerfunc(myarg)
  3  ->     myinnerfunc(myarg - 1)
  4
  5
  6 B   def myinnerfunc(innerarg):
  7         return 1 / innerarg
  8
  9
 10     myfunc(1)
[EOF]
Since we know, that the error only happens when we are in the second call of
the function myinnerfunc, we can use the continue command to continue the
same breakpoint but in the second time we call it. We can then also print out
the variables again:
(Pdb) c
> test.py(7)myinnerfunc()
-> return 1 / innerarg
(Pdb) innerarg
0
If we would now execute the next line, we would raise the initial error, the
ZeroDivisionError. We can however simple override the variable innerarg
with some other value
(Pdb) innerarg = 10When we now execute the next line, the value can be computed and the result is returned:
(Pdb) n
--Return--
> test.py(7)myinnerfunc()->0.1
-> return 1 / innerarg
Using a graphical debugger
Various IDEs (such as Visual Studio Code) allow for a more convenient debugging approach, directly incorporated into the IDE. The concepts remain very much the same, but can be used in a way more convenient manner, directly where we are writing the code.
The following examples will deal with the setup and debugging in Visual Studio Code.
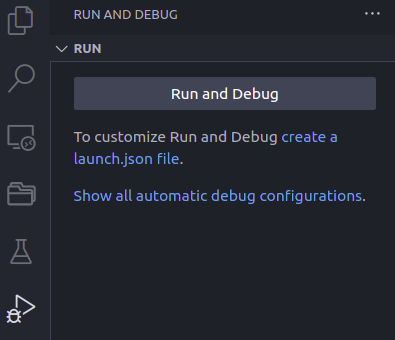
In order to debug a Python file, it needs to be opened in the editor. Then the debugging view needs to be opened (the triangle symbol with the small bug).
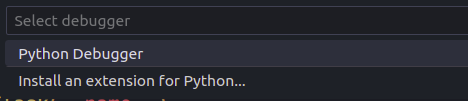
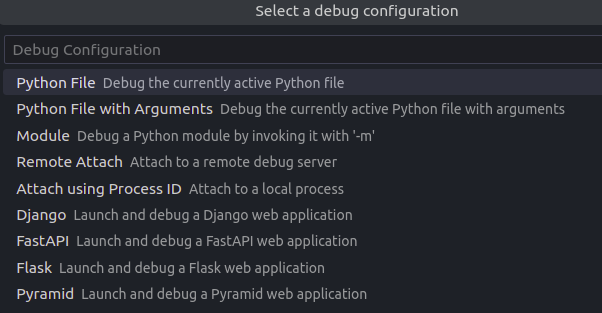
Next select "Python Debugger" and then "Python File".
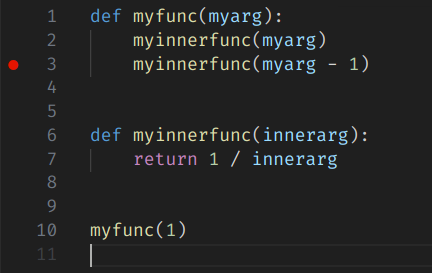
Now the debugging can actually start. Conveniently, breakpoints can directly be set in the text editor by clicking next to the line number where you want the breakpoint to be. An active breakpoint can be seen as a red dot. Clicking on it will remove it again, with a right click we can add a condition for the breakpoint to trigger.
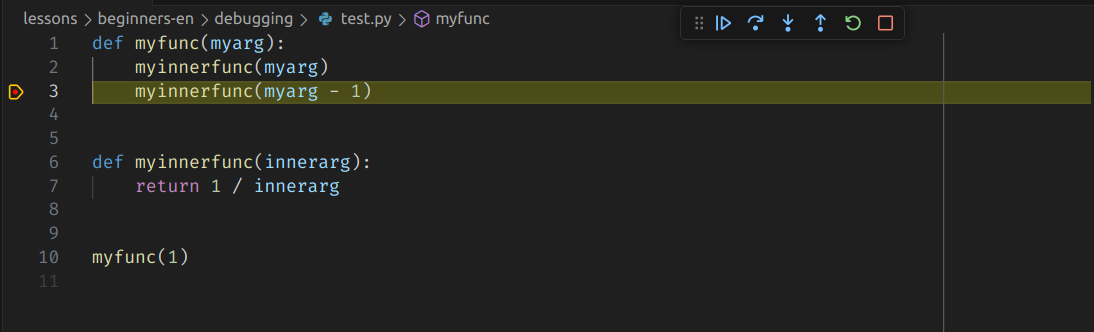
When we are running our code we can conveniently inspect the context of our running program, showing us the variables and their values (where we can also modify them):
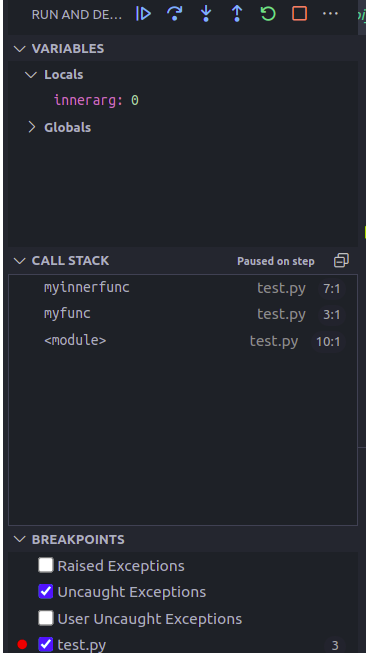
Conveniently, we can see the call stack (we can simply move up/down by clicking on the item in the stack) and we can also see a list of all breakpoints, which can then also en-/disable. There are also breakpoints for all raised or uncaught exceptions, which can help as well.
When debugging, this small window for controls is available to allow navigating the code:
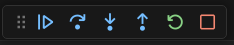
The blue triangle allows to continue to the next breakpoint (same as
c(continue) in PDB). The arrow above the point executes the next line, but
does not step into a function (same as n(ext)). The arrow down to the point
makes the next step, but also steps into a function (same as s(tep)), whereas
the arrow up runs the function to its end until it returns. The green rewind
error restarts the programming and the red square stops the program.
Conclusion
Debugging is a necessary activity to get rid of bugs in our software, whether
we use print()-style debugging or use a dedicated tool.
Dedicated tools are more complex, but far more powerful in helping us understand problems and their specific contexts they appear in.